
HCS Analyzer
(Install) - Download form SourceForge
News:
We are currently working on many new and useful improvements such as: connection to Opera(TM) imaging platform, DRC analysis,
drug-to-drug interaction (isoboles, etc...) and soon we should be able to propose you a single cell based analysis (including classification, clustering etc..).
v1.0.4595 (08/01/2012) (Src):
Functionalities:
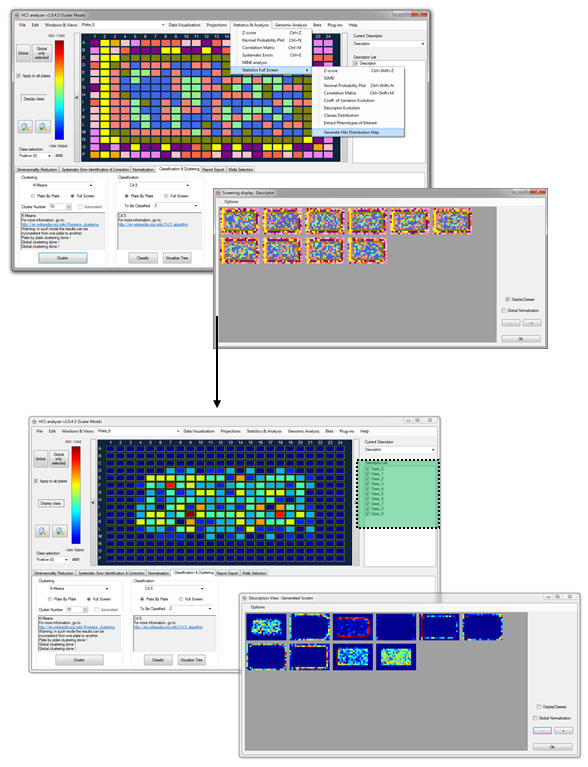
- "Statistics & Analysis->Statistics Full Screen->Hits Distribution Maps" menu generates a plate of 10 descriptors, each descriptor representing the distribution of each original class.
This is particularly useful to check if the hits are randomly distributed.
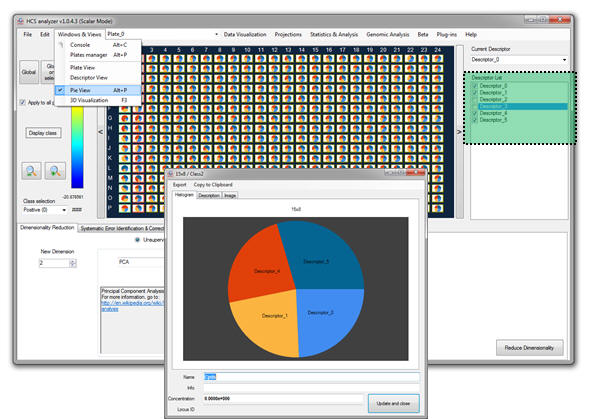
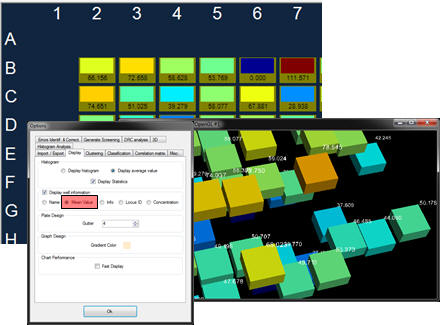
- "Window & View->Pie view" switch the display mode to "Pie". In this mode, each well display a pie where each part is related to each active descriptor.
This is particularly useful when the chosen descriptors represent a ratio (such as the ones generated during a cell-by-cell classification).
The contextual menu "info" associated to a well has been updated to display the pie in "Pie Mode".
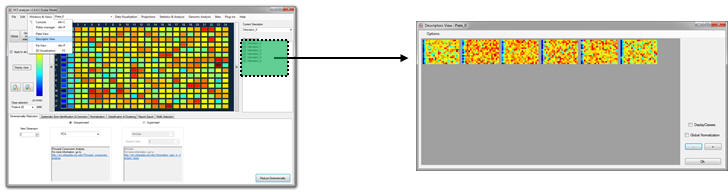
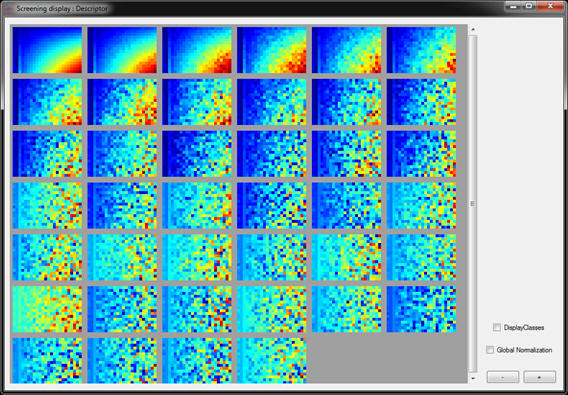
- "Window & View->Descriptor view" displays in a single window a global view of all the active descriptors associated to the current plate.
(accessible too through the context menu of the "descriptor List").
- Classes distribution has been included in the report
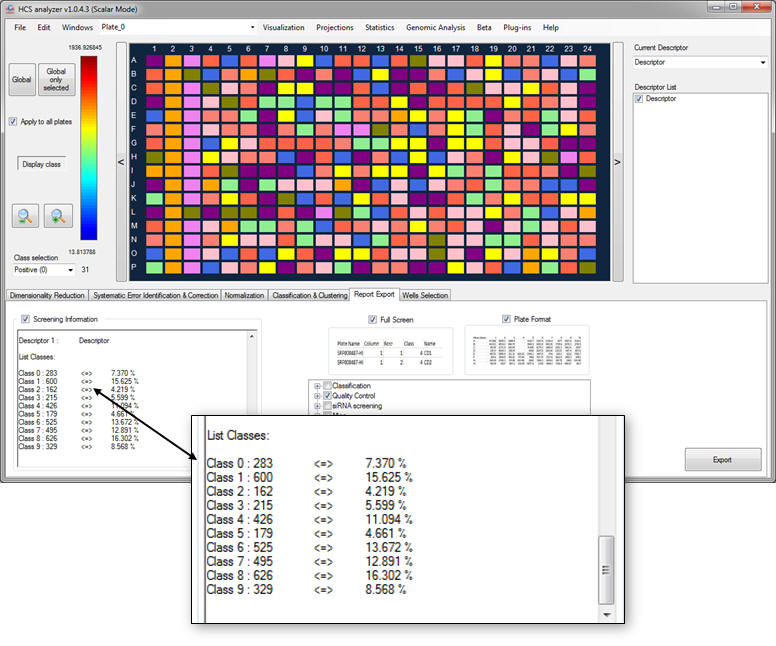
and in the statistics menu:
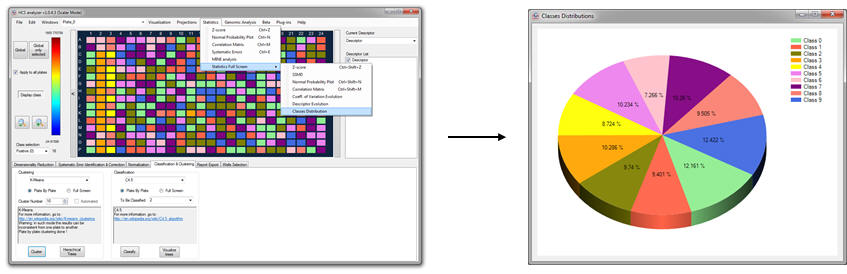
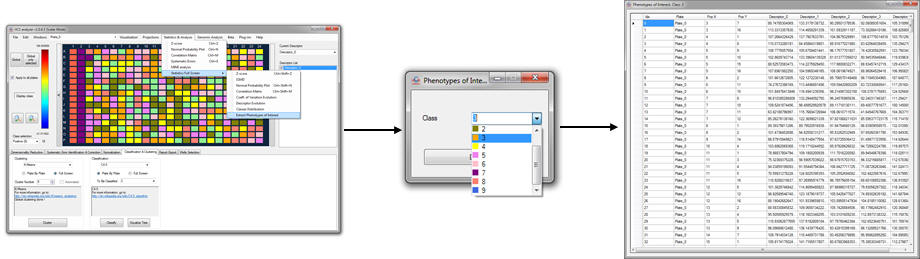
- "Statistics & Analysis->Full Screen->Extract Phenotypes of Interest" displays the signatures of the wells from a selected class.
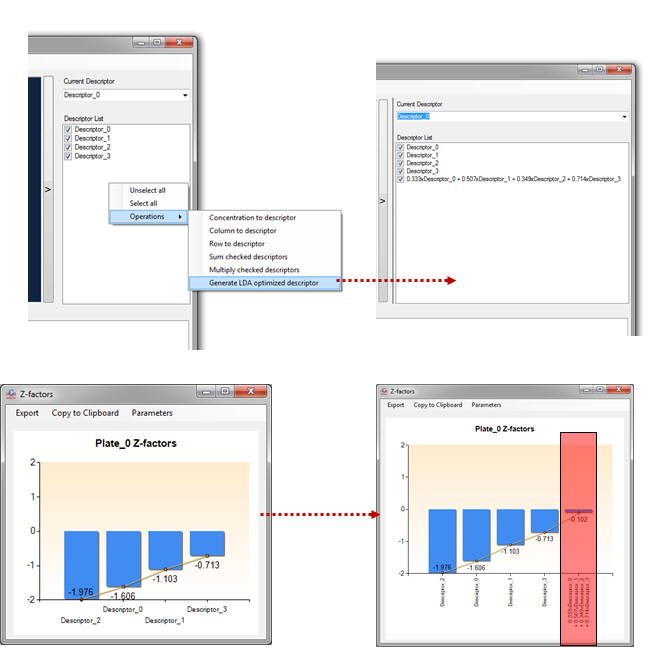
- the LDA based descriptor optimization is also accessible directly from the descriptor box.
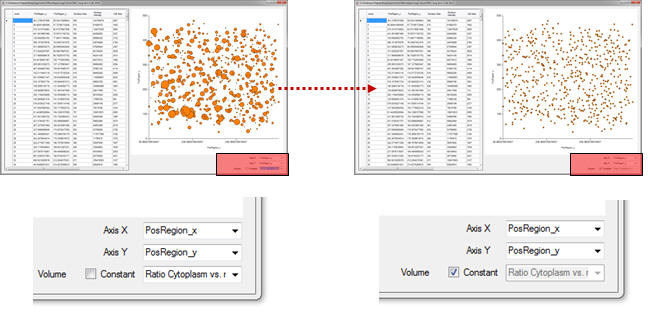
- On the cell-by-cell view, the marker area value can be linked to a descriptor.
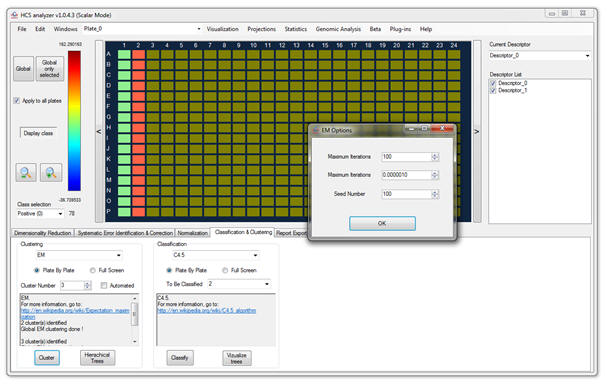
- Options windows have been added when clicking on Cluster and Classification buttons
User interface: - Average values can be displayed on top of the wells (2D/3D).
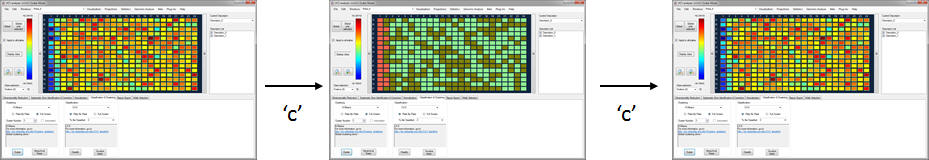
- shortcut Key 'c' to switch between 'display class mode' and 'regular display mode'
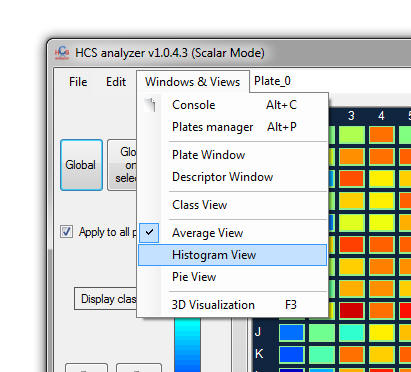
in a more general way, the different visualization have been centralized in the menu "Windows and Views"
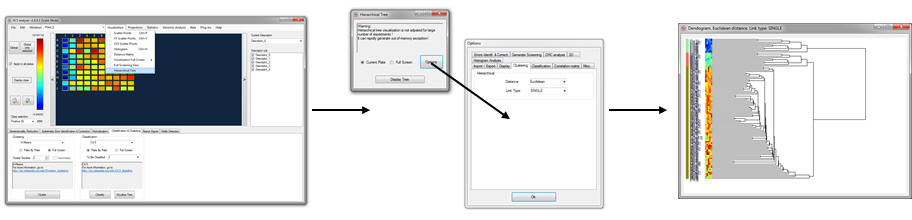
- Hierarchical tree visualization user interface has been updated, and options are directly accessible before processing.
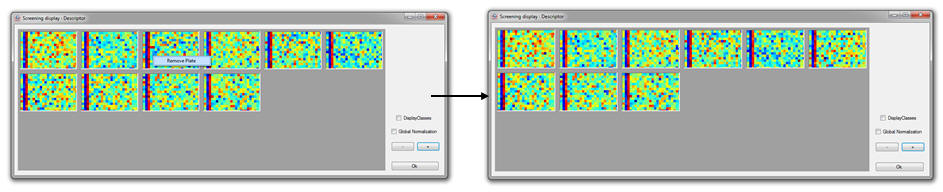
- One can remove a plate from the "full screening" view by right clicking on the plate of interest, and choose "Remove Plate" in the contextual menu.
The new screening design can be applied the active screening by clicking on "Ok".
bug fix: - message box prevent the user from displaying scatter points (screening and plate) when only one well is available.
- update the class display after generating a new screening
v1.0.4.3 (05/14/2012): (Src)(Bin)
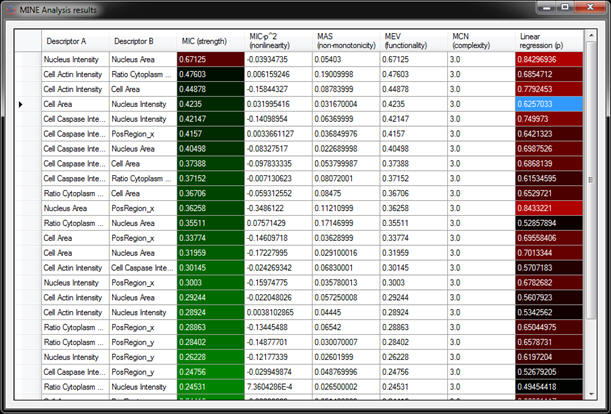
Functionalities: - add maximal information coefficient (MIC) and MINE analysis to identify complex functional correlations between descriptors.
Reshef et al., Detecting Novel Associations in Large Data Sets, Science, Dec. 2012.
- new operations on descriptors (square, sine, cosine, sum, multiplication etc.).
- the user can generate a new descriptor defined as the first axis of the LDA.
- Add a screening view (double clicking makes the plate active).
Improvements: - when generate univariate screening it can be added as a descriptor only.
- one can generate artificial histogram based screenings.
- add vector cosine angle, Earth Mover Distance metric for histograms comparison.
- visualization of the entire screening.
User interface: - new options for 3D data visualization: change point and font size.
- new short keys : 'd' and 's' to switch between distribution and scalar display.
- when distribution mode is active, Well Info display also the reference curve
- for histogram based screenings, info displays average too.
- in scatter points (1D and 2D): double click opens the plate and well information of the selected well. Right click open a contextual menu when the user can redefine the point class.
- when double click on a row or column number, that row (or column) class turns into the active selected class.
- 3D options are accessible directly from the 3D view.
and new interface design:
Bug fix: - when generating an artificial screening, the available plate list was not updated.
v1.0.4.2 (03/20/2012): (Src) (Bin)
Functionalities: - just like "Info", "Name" or "Locus ID", one can associate a value "Concentration" to each well.
Improvements: - faster display of the first plate after loading.
User interface: - add "number of active well" in the report rich text box (this is also exported).
- add a warning message box for "screening->hierarchical tree" to prevent out-of-memory exception.
- possibility to change Y-axis maximum and minimum values as well as marker size on most of the graphs (via contextual menu).
- add more information during the normalization process.
Bug fix: - add a new plate to an already loaded screening (same descriptors).
- the scatter point number displayed in the window title was wrong.
- fix the loading when a "name" is not well formatted in the csv file.
- fix the normalization that was not properly associated with the selected class.
- CSV loader accepts to load missing data.
v1.0.4.1 (03/08/2012): (Src) (Bin)
User interface: - Better display of the selected descriptor within the tooltip.
- Open automatically the selected directory after export.
Bugs fix: - "remove descriptor" wrong LUT update.
- Generate automatically a folder "Plugins" if not present.
v1.0.4.0 (01/08/2012): (Src) (Bin)
First release